If it gets complicated, try to make it simple 🙂

created by @franziherz96

Discussing assets and drawbacks of learning analytics (LA) and social network analysis (SNA) in particular leads to discussing the objectivity of data collection. Applying these methods not only enables live-data tracking and analysis (as opposed to self-reported pre-/post-course surveys) but the objective analysis of learner’s traces in the learning environment (though this does not account for a complete picture of the learning which takes place). However, the potential stays untapped if underlying pedagogical and epistemological assumptions are not taken into account.
Gašević, D., Dawson, S., Siemens, G. (2015) point this out as they claim LA to connect existing research on learning, teaching, educational research and practice. They bemoan missing studies which evaluate the concept of the established lead indicators of LA. Three major themes in their paper are the detailed description of how tools are used, looking beyond frequency of activity and time spent on task by analyzing individual learning strategies and products and the connection of internal and external conditions for data. Within this context the base for effective LA visualizations lies in the consideration of instructional, learning and sense-making benefits – foundations in distributed cognition and self-regulated learning being a potential direction of future research.
Knight, S. et al. (2014) identify LA as implicitly or explicitly promoting particular assessment regimes in the epistemology, assessment and pedagogy triad. A wonderful, more detailed reflection on this triad in connection to learning analytics can be found here (authored by Classroomaid). Suthers, D. D. & Verbert, K. (2013) define LA as the “middle space” between learning and analytics. In their paper they elaborate three main themes for future research in the field of LA: “the middle space” (focus on the intersection between learning and analytics, avoiding the emphasis of one of these themes), “productive multivocality” (facing the challenge of unifying a multifaceted research field by focusing on analyzing a common data ground) and “the old and the new” (enhancing learning as a century-old idea that is continuously accompanied by new tools) (pp1). Given the rich online learning landscape, clustering learning environments can be the first step of detecting characteristics, underlying epistemology-assessment-pedagogy beliefs and thus identifying the appropriate measures of learning analytics.

For example Rodriguez (2012) classified MOOCs as either c-MOOCs (following the connectivist tradition) or x-MOOCs (“AI-Standford like courses”, following the cognitive-behaviorist tradition). It is important to note here, that the term “x-MOOCs” was not coined by Rodriguez, but Liyanagunawardena, T., et al. (2013) establish ties to Daniel (2012), where they detected similar definitions and thus combined both papers. For his classification Rogriguez used Anderson & Dron’s (2011) paper on “Three Generations of Distance Education Pedagogy” where they coin three DE pedagogy concepts. Bringing the triad back into focus: it’s the pedagogy concept that supports his classification – differentiating between connectivistic and cognitive-behavioristic pedagogy.
The implication of this classification is a different view on teaching, social and cognitive presence in the online learning environment. This view needs to be considered when analyzing the underlying epistemological concept and the assessment formats. Besides common features, this relates especially to the role of course instructors, the definition of openness (access vs. openness to personalized learning), connectedness and guidance. Knowledge is either generative (c-MOOC) or declarative (x-MOOC). By saying so, without a coherent triad the best assessment strategy does not tackle the real learning happening. Furthermore, the triad can be used to continuously challenge the assumptions of each corner.
One example of this triangular interplay is active learning. Grunspan et al. (2014) mention the effectiveness of active learning in college classrooms and as a result they explore this practice with the support of Social Network Analysis. However, the triad does not implicitly determine direction and interdependencies. Critical reflection of all intersections is necessary. This exemplifies the importance of meta studies, e.g. “What makes great teaching? Review of the underpinning research” by Robert Coe, Cesare Aloisi, Steve Higgins and Lee Elliot Major (2014). A call for a constant challenge of learning assumptions, the participation in the on-going research process and the relation and integration of own research efforts go hand in hand with the importance of comparing different underlying concepts and critically questioning if researchers are particularly considering the same concepts. As one example of this meta study, active learning and its outcomes for the learning progress seem to contradict Grundspan et. al. By relating to a learning pyramid, Coe et al. argue that memory and remembering is not evidently based on being better when participating actively or passively (“Ensure learners are always active, rather than listening passively, if you want them to remember (p24)). Simply the different level of complexity of both concepts (active learning and active/passive listening in relation to memorizing) discloses that we are not exposed to the same ideas here. However, these approaches seem to be connected and point in opposing directions of sound research evidence. When validating and examining existing research, it becomes more and more important to nail the underlying assumptions and research questions to create reliable conclusions for further research.
The course presents six different case studies which emphasize the claim that learning design can influence learner’s decision. By doing so, the above triad is underpinned again – not only focusing on practical applications but also giving a direction for future research approaches that critically question underlying concepts of epistemology, pedagogy and assessment.
Lockyer et al. explore how the framework for the interpretation of LA might lie in the learning design. By using case-based learning they examine a concept of checkpoint and process analytics to analyse learning design embedded in a context, in real-time and behavior-based (a more narrowed-down application of LA). Hence, learning design and analytic design are connected to support learning and teaching decisions. They also propose different directions for future research including “engaging teachers and students in understanding and using visual patterns of interaction as a means to encourage learning activity; scaling up to larger numbers of classes, providing a base for comparing statistically the observed to expected analytics of behaviors and interactions; and using results to provide meaningful feedback to teachers on how their learning design is meeting their pedagogical goal and to assist them in decisions around design and pedagogical change in real time.” (p1455)
The research question in this study is “Is the composition of social networks evolving from a unit discussion forum related to the sense of community experienced among the student cohort?” (p226). In general, this deals with the question of belonging vs. isolation, or better: with the extend to which learners benefit educationally from belonging and how this can operate as a predictor for students success (as social integration is strongest predictor for retention and completing university degree). The underlying educational concept is community-centered teaching practise, based on social-constructivistic ideas of Dewey and Vygotsky. The novelty with this study is that self-reported surveys are not the only data source anymore. It is a mixed method approach used here which focuses on quantitative (Classroom Community Scale, SNA centrality measures) and qualitative measures (discussion forum content, student interviews). As a result, Dawson found a association between the network position and the sense of community, in detail a positive association with closeness and degree centrality; a negative with betweenness centrality (dilemma of brokerage). In addition, pre-existing external social networks influence the type of support/information required. Concerning future research Dawson points towards the investigation of the relation between social networks and other measures having an influence on the learning environment such as pedagogy, practitioner personality and cohort demographic profiles.
Dawson, S. et al. discuss the correlation of cognitive playfulness to the network position where degree and betweenness centrality are oppositional to closeness (as they are positive indicators of a learner’s creative capacity) . By answering their research questions “What is the relationship between a student’s social network position and perceived creative capacity? To what extent do discussion forum mediated social networks allow for the identification and development of student creativity?” they claim that SNA can provide insight in the creativity of students as well as a tool for instructors to monitor the learner’s creative capacity level. The individual’s self-reported creativity score thus corresponds with the overall social network position. Creativity is perceived as highly valued graduate asset.
Gašević, D. et al. studied cross-class networks and the importance of weak ties by considering the relationship between academic performance and socal ties. The base for this study is social capital and network learning research. Two hypothesis where investigated: (1) “students’ social capital accumulated through their course progression is positively associated with their academic performance”; and (2) “students with more social capital have a significantly higher academic performance.” Based on the ideas of Vygotsky one practical implication is the conception of new social ties in each course during degree programs.
This study focuses on the Community of Inquiry model, specifically on the social presence as one contributor to educational experience. Social presence consists of three parts, namely affectivity and expression, interactivity and open communication and cohesiveness. By analyzing the underlying social processes that contribute to the development of social capital, Kovanović, V. et al. give an insight in how affective, cohesive and interactive facets of social presence significantly predict the network centrality measures commonly used for measurement of social capital. Social constructivist pedagogies and the shift towards collaborative learning can be seen as underlying educational concepts. The research question “What is the relationship between the students’ social capital, as captured by social network centrality measures, and students’ social presence, as defined by the three categories in the Community of Inquiry model?” (p3) leads to the results that interactive social present is “most strongly associated with all of the network centrality measures, indicating a significant relation with the development of the students’ social capital.” In conclusion, in-degree and out-degree centrality measures were predicted by all categories of social presence whereas betweenness centrality was predicted by interactive and affective categories.
Skrypnyk, O. et al. explore the learning environment of a cMOOC to identify and understand important key actors. Although in this study the facilitators continued to occupy a central role, other actors emerged and complemented this picture. This was based on the two research questions “What is the influence of original course facilitators, course participants (ie., learners) technological affordances on information flows in different stages of a cMOOC?” and “What are the major factors that influence the formation of communities of learners within the social network developed around a cMOOC?”. As a result, types of authorities can be classified as “hyperactive aggregators” and “less visible yet influential authorities”. For the former, there might be an existing connection to natural personality traits. Another outcome is the importance of hashtags for information flow and community construction within a more learner-centered environment supported by software.
By combining Gephi and Tableau I created a dashboard, where it is possible to see different ways of visualizing the same data source. Please click the image to enlarge it and see descriptions for the single sheets on the dashboard. As my first attempt, this dashboard shall illustrate how conclusions could be drawn from one single glance.
For example, the network analysis with Gephi detects the network structure and reveals node 3 as a central key actor when it comes to the measure of degree (top right). 9, 10 and 11 follow with some distance. The same pattern can be detected in the top left visualization, where size represents degree as well, but the color reveals betweenness. We can conclude, that degree and betweenness are correlated, as a decreasing quantity of connected nodes goes hand in hand with a decreasing betweenness (not surprisingly, but due to the image more visual). The Degree sheet down left specifies in- and out-degree values – again we see the network key players 3, 9, 10, 11 but here we can specify their communication patterns. Whereas 3 has the highest out-degree but the smallest in-degree, it’s actor 11 that has the highest in-degree and the smallest out-degree. Dependent on the underlying question, we could draw better conclusions at a glance from this data.

Still, there are some open questions regarding Gephi from my last post but I found a nice point of departure from @Edu_k ‘s blog post on Gephi Layouts.
Anderson, T. and Dron, J. (2011). Three Generations of Distance Education Pedagogy,International Review of Research in Open and Distance Learning, Volume 12, Number 3. Retrieved from http://www.irrodl.org/index.php/irrodl/article/view/890/1663
Classroomaid (2014-11-14). Our Learning Analytics are Our Pedagogy, Are They? (#xAPI, #dalmooc), retrieved on 2014/10/23 from http://classroom-aid.com/2014/11/14/our-learning-analytics-are-our-pedagogy-are-they-xapi-dalmooc/
Daniel, J 2012. Making Sense of MOOCs: Musings in a Maze of Myth, Paradox and Possibility.Journal of Interactive Media in Education 2012(3):18, DOI: http://dx.doi.org/10.5334/2012-18
Dawson, S. (2008). A study of the relationship between student social networks and sense of community. Educational Technology & Society, 11(3), 224–238 (full text).
Dawson, S., Tan, J. P. L., & McWilliam, E. (2011). Measuring creative potential: Using social network analysis to monitor a learners’ creative capacity. Australasian Journal of Educational Technology, 27(6), 924-942 (full text).
Edu_k (2014/11/14). Social capital in SNA for LA – too much focus on individuals at a cost of the group, retrieved on 2014/11/24 from http://nauczanki.wordpress.com/2014/11/14/social-capital-in-sna-for-la-too-much-focus-on-individuals-at-a-cost-of-the-group/
Gašević, D., Dawson, S., Siemens, G. (2015). Let’s not forget: Learning analytics are about learning. TechTrends (in press),http://www.sfu.ca/~dgasevic/papers_shared/techtrends2015.pdf
Gašević, D., Zouaq, A., Jenzen, R. (2013). Choose your Classmates, your GPA is at Stake!’ The Association of Cross-Class Social Ties and Academic Performance. American Behavioral Scientist, 57(10), 1459-1478. doi: 10.1177/0002764213479362 (full text).
Grunspan, D. Z., Wiggins, B. L., & Goodreau, S. M. (2014). Understanding Classrooms through Social Network Analysis: A Primer for Social Network Analysis in Education Research. CBE-Life Sciences Education, 13(2), 167–178. doi:10.1187/cbe.13-08-0162 (full text)
Knight, Simon; Buckingham Shum, Simon and Littleton, Karen (2014). Epistemology, assessment, pedagogy:
where learning meets analytics in the middle space. Journal of Learning Analytics (In press).
Kovanović, V., Joksimović, S., Gašević, D., Hatala, M., “What is the source of social capital? The association between social network position and social presence in communities of inquiry,” In Proceedings of 7thInternational Conference on Educational Data Mining – Workshops, London, UK, 2014 (full text).
Liyanagunawardena, T., Adams, A., & Williams, S. (2013). MOOCs: A systematic study of the published literature 2008-2012. The International Review Of Research In Open And Distance Learning, 14(3), 202-227. Retrieved from http://www.irrodl.org/index.php/irrodl/article/view/1455/2531
Lockyer, L., Heathcote, E., & Dawson, S. (2013). Informing pedagogical action: Aligning learning analytics with learning design. American Behavioral Scientist, 57(10), 1439-1459, doi:10.1177/0002764213479367 (full text).
Rodriguez, C. O. (2012). MOOCs and the AI-Stanford like courses: Two successful and distinct course formats for massive open online courses. European Journal of Open, Distance and E-Learning. Retrieved from http://www.eurodl.org/?p=Special&sp=init2&article=516
Suthers, D. D., & Verbert, K. (2013). Learning analytics as a “middle space.” In Proceedings of the Third International Conference on Learning Analytics and Knowledge (pp. 1–4). New York, NY, USA: ACM. doi:10.1145/2460296.2460298
Skrypnyk, O., Joksimović, S. Kovanović, V., Gasevic, D., Dawson, S. (2014). Roles of course facilitators, learners, and technology in the flow of information of a cMOOC. British Journal of Educational Technology(submitted) (full text).
In my last post about the #DALMOOC I described the course structure, its challenges and relected on the content. It is a nice structure but it does not contribute to readability. This time I will try a different approach. By pointing towards the three exclamation marks (in the figure below) as main themes of the post, I will interweave different resources, competencies and assignments.
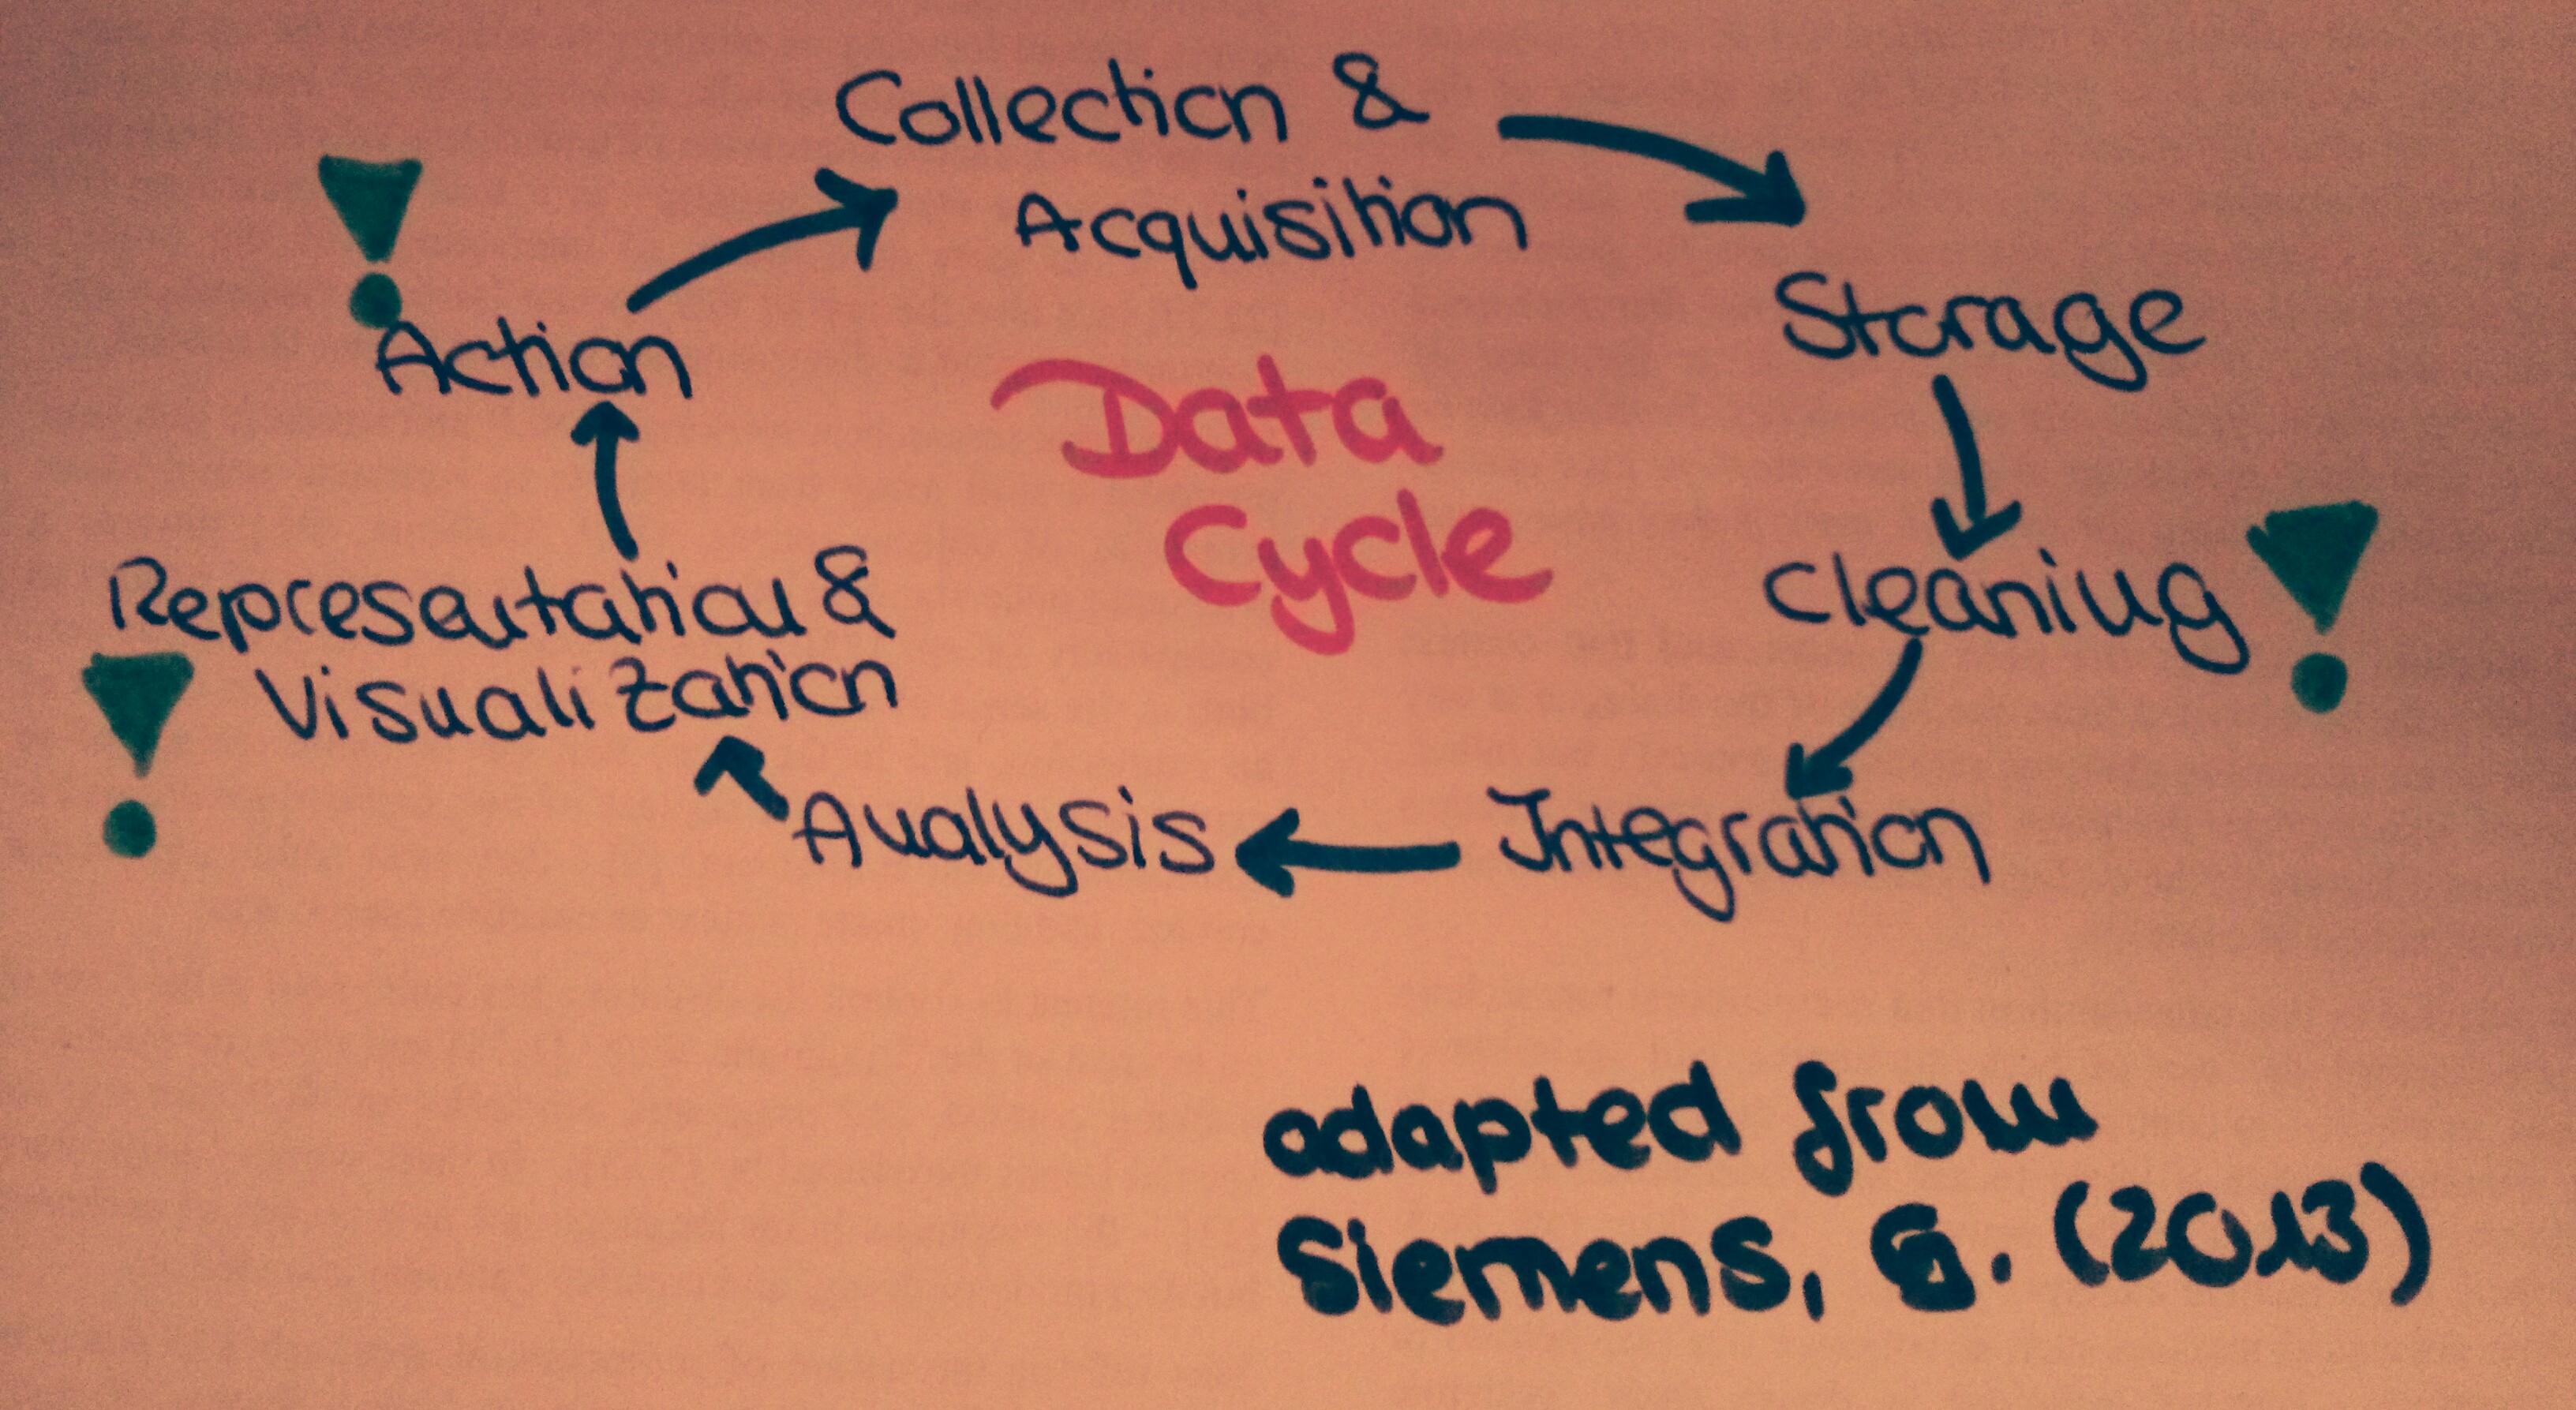
The data cycle is the main theme for week 2’s content of #DALMOOC. This data cycle (or data loop) consists of seven successive steps which are necessary to make learning data meaningful. Data Cleaning and integration can only take place after a potential data source has been identified and the data has been stored. The cleaning and integration part is especially important when it comes to combining different data sets as both need to be able to “communicate” with each other. The figure visualizes that the actual analysis of data is only the 5th step in the cycle – highlighting the importance of planning the analytics process. The action taken based on data relies mainly on the representation & visualization of it. By representing and visualizing them, data (or better: our analysis results) is “socialized” to ease the understanding of the analyzing results. [related to Competency 2.1: Describe the learning analytics data cycle]
No word on learning so far, but before diving deeper in the data cycle context I want to come back to my definition of learning analytics: “The field of Learning Analytics offers methods to analyse learners’ behavior in a learning environment and by this providing groundwork and significant potential for the improvement of learning environments, and individual learner’s feedback and learning outcomes” The bold parts have been added with regards to Shum, S. B., & Ferguson, R. (2012) [Social Learning Analytics. Educational Technology & Society, 15(3), 3-26]. I adapted my definition as the term “potential” points towards the possible future development of (S)LA and “learning outcomes” as it adds a significant part to what needs to be improved: the result of a learning process.
Shum & Ferguson also introduce the interesting concept of Social Learning Analytics (SLA). It is based on learning theories and pinpoints learning elements that are significant in a participatory online culture. Primarily, they acknowledge that learners are not learning alone but engaging in a social environment, where they can interact directly or their actions can be traced by others.
While this is a new context for thinking about analytics, we need to understand the possibilities offered by SLA, which are either social itself (e.g. social network analysis, discourse analytics) or can be socialized (e.g. social learning disposition analytics, social learning content analytics). Moreover the challenge of implementing these analytics is still present. Shum & Ferguson emphasize the impact of authentic learning from real-world context through the use of practical tools. Important features of a participatory online culture are the needs for a complementary open learning platform (“digital infrastructure”), the understanding of how open source tools can enable people to use the potential of these tools (“free and open”), the importance of SLA as a part of individual identity and credibility of skills (“aspirations across cultures have been shifting”), SLA as integral part of an employee’s toolkit (“innovation in complex, turbulent environments”) and analytics as a new form of trusted evidence (“role of educational institutions is changing”). Social learning adds a particular interest in the non-academic context.
What is left are still the challenges of powerful analytics: which measures do we use? Who is defining them? What do we want to measure? How do we define access rights? Are we focusing too much on by-products of online activity? How do we balance power?
Ealier I was claiming that usability is not always what we need. Shum & Ferguson are stating “User-centered is not the same as learner-centered: what I want is not necessarily what I need, because my grasp of the material, and of myself as a learner, is incomplete”. When it comes to start working with a data set it is highly important that it is as complex and complete as possible. If not the data set itself, there is no other element in the cycle that has the potential to embody the complexity of the problem. It is the visualization that simplifies and “socialises” the data, not the data cleaning nor the integration and analysis.
That automatically calls for “quality data” [Siemens, G. (2013). Learning analytics: The emergence of a discipline. American Behavioral Scientist.]. Siemens introduces this idea (besides others) with a quote from P. W. Anderson “more is different”. In my opinion, this in one of the key elements of learning analytics and/or analytics in general: we are afraid of complex data because at a certain degree we are not able anymore to process them. Instead of refusing data sets based on complexity, good analytics can help us (as a “cognitive aid” according to Siemens) to process them and make sense of them. Because data will not stop existing – by refusing to handle them we make our lives easier but we might ignore potential sources to understand our lives better. We failed with classification systems so now time has come for big data and algorithm.
In addition to techniques of LA (as in Baker and Yacef 2009, adapted in my last post) Siemens mentions categories of LA applications. These are used for modeling user knowledge, behavior and experience. Thus, they can create profiles of users, model knowledge domains; perform trend analysis, personalization and adaptation. Siemens illustrates his point by giving the quote “A statistician may be more interested in creating probability models to identify student performance (technique), whereas a sociologist may be more interested in evaluating how social networks form based on technologies used in a course application.”
There was a time when I had to work with SAP, data sets and visualization of these sets every day. And I am thankful for one lesson I learned during this time: Never change your data set to make it more illustrative. Keep the data set and base you visualization on it. That’s the reason I like Pivot tables so much. They have the potential to illustrate your analysis results, other users can adapt them and the data set will stay the same.
However, on has to keep in mind that analytic tools are programmed by others and to understand the way they work it is important to be familiar to the methods in use and how they are applied within such tools. During the DALMOOC we will work with different data analyzing tools. One of them is Tableau.
[related to Competency 2.2: Download, install, and conduct basic analytics using Tableau software]
![]()
Tableau is a software that helps you in visualizing your data (based on business intelligence approaches). It has an impressive range of options for this purpose, which is (from my point of you) easy to understand and to apply. Data can be imported in different formats and besides common bar charts one is able to create “interactive” dashboards, an arrangement of visualizations that other user can adapt via filter and that can show you more details of the data-set on demand.
However, making data fit into Tableau can be challenging. The data sets have to be formatted in a certain way so the software can work with them. That was what I faced when going a little beyond #Assignment56 from the DALMOOC assignment bank “Finding Data”. [As the title says, find data sources that can you used in Tableau (you will need to watch the Tableau videos for this week in order to become familiar with this). Look for educational data on government, university, or NGO sites. Create a blog post (or post to edX forum) on these data sources.]
Coming from Germany, I did some research on the Open data movement there. The Bundeszentrale für politische Bildung BPB (Federal Agency for Civic Education) offers an Open Data Dossier, where they describe the idea of Open Data, case studies and current running projects. In their words, the idea of Open Data is to make them available and usable for free. In this respect it is important to know the potential of data and data journalism for sustainable democratic development. Yet, this platform does not offer data sets itself but refers to a general framework for such a platform and to local pilot projects.
In this context they refer to the term “Hyperlokaljournalismus” that can be seen as opposite towards the classic idea of “Lokaljournalism”, offering very specific and detailed news in a dynamic way. They can be adopted to the location of the user and thus concentrate on immediate surroundings.
Three examples of Open Data platforms are daten.berlin.de, offenedaten.de and the “Statistisches Landesamt Rheinland-Pfalz“. Formats and range of data differ on each platform, but the idea is related to the statements of BPB: offer data for free and available for everyone. Nevertheless, browsing bigger institutions for data sets, it was mostly the visualization and not the data set that was available. For the data set, sometimes you had to download a form, sign it and describe the purpose you want to use the data for and then send it via telefax or e-mail. Why should I do this, when I am just looking for a data set for a individual analysis? I see the point that data collection can be very demanding and a researcher wants to protect his/her work. But when will we finally accept, that Open Data can contribute to a collective researcher community that works on data together? How do you enable easy data-check-ups if I have to send you an e-mail beforehand? And regarding the different data-set formats and integrating them in a certain tool: How long will we still need to clean data so they will fit in our analyzing tool? Will there be a future without the need to edit data formats? I do hope so.
Although action was not a major theme in the course, I find this a very important part of the data cycle one has to consider. Particularly the action depends on data visualization so it is crucial to know whom we are visualizing our analyzing results for and what their needs are. This can be seen in organizational levels as well (“micro-, meso- and macroanalytics layers” according to Siemens) where we can have top-down and bottom-up approaches and the application of different questions and viewpoints. This emphasizes the directions LA can take and how they need to adapt according to the interest group they are serving. The main interest group – the learner and his/her need – however, might not be forgotten in this context. [related to Competency 2.3: Evaluate the impact of policy and strategic planning on systems-level deployment of learning]
Coming back to Siemens, he describes the challenges of LA (besides the data quality) as privacy and centered on human and social processes. I had the chance to touch upon the privacy topic during the Bazaar assignment, where I was in a group with him by chance. This again shows me the value of interactive tools when they are used in a suitable way.
Privacy is also one major topic Duval writes about in Duval, E. (2011, February). Attention please!: learning analytics for visualization and recommendation. In Proceedings of the 1st International Conference on Learning Analytics and Knowledge (pp. 9-17). ACM. She describes machine readable traces for attention and raises the question what should be measured to understand how learning takes place. In regard of privacy she touches upon what elements should be tracked and if the user should be aware of this. She refers to the “Attention-Trust” principles of property, mobility, economy and transparency. The term “filter-bubble” is introduced, as connected to the idea that filtering per se can be a threat and can anticipate user choices and ideas. This is somehow related to Shum & Ferguson’s user-/learner-centeredness as it is always a question of who sets the filter and how do the filter work.
I would love to spend more time with working in Tableau and other tools in this course. But I fear I cannot cover this within the given timeframe. So I will focus on the tool matrix and complete it while using the tools for basics explorations, doing the readings and dealing with other course resources.
So far, the #DALMOOC is one of the most complex online courses I have enrolled. Contentwise it covers “an introduction to the logic and methods of analysis of data to improve teaching and learning”. What is especially challenging is the course structure and the social tools involved.
In this post, I will first describe the course structure and state key messages from week 1’s content (Assignment: “share your reflections on week one in terms of a) content presented, and b) course design”). After this, I will present my bullet points for the four readings as a completion of the key messages (Assignment: “review the additional readings available for week 1 of the course and share your reflections about them”). Finally, I will attach my edited Learning Analytics Tool Matrix (Assigment: Learning Analytics: Tool Matrix) where I conducted some research on learning analytic tools.
What is making the course so complex is the high amount of social tools and pathways to chose from. The basic idea is that there is a Guided Learner Path (“blue pill”) and a Social Learning Path (“red pill”) available. Either, one can chose one of those or get involved in both. To keep it simple, the blue pill is the structure learners are most familiar with: course content is provided as in a typical classroom environment where the teacher is providing the knowledge. The red pill however, is a social approach where learners interact via social media (e.g. Prosolo, Twitter) and share their artifacts.
Based on this structure a range of tools is in use to track the learning progress. Generally speaking, edx provides solely the platform for the course content. Interaction is recorded via Prosolo (a platform connected to edx, to show learning goals and competencies, share thoughts and form groups, fulfill assigments). For example, this blog post will be recorded (or tracked) in Prosolo and thus can be made available for peer assessment. In addition, there are features at which enable the user to track #dalmooc hashtags on Twitter or RSS feeds.
When talking about Learning Analytics, there usually are tools involved that apply the theoretical knowledge. In this course, we will deal with Tableau, Gephi, rapidminer and LightSide. An additional problembank is provided for advanced assignments to work with these tools.
The social learning aspect is supported by a tool called bazaar (Bazaar assignment: Discuss Week 1). Bazaar is a plattform (basically a chat system) that connects learners on demand to discuss course related topics and contents. In my case I was connected on Saturday evening to a very helpful person from India. There is a programmed digital instructor that guided us through the discussion. After an introduction we were to discuss why we take this course, how we define learning analytics, how useful we found the used cluster for learning analytic tools and how it could have been improved. We had a very constructive discussion that benefited from the fact that we had different backgrounds and levels of expertise.
My key messages for this week are
Usability and complexity of data
[Halevy, A., Norvig, P., & Pereira, F. (2009). The unreasonable effectiveness of data. Intelligent Systems, IEEE, 24(2), 8-12.]
[Tansley, S., & Tolle, K. M. (Eds.). (2009). The fourth paradigm: data-intensive scientific discovery.]
The field of Learning Analytics
[Baker, R. S., & Yacef, K. (2009). The state of educational data mining in 2009: A review and future visions. JEDM-Journal of Educational Data Mining, 1(1), 3-17.]
[Baker, R., & Siemens, G. (2014). Educational data mining and learning analytics. Cambridge Handbook of the Learning Sciences.]
By clicking on the above headline, my adapted tool matrix can be accessed. It is my point of departure, as I am still working on it. I want to specify the tools I added (printed in Italic), visualize the different phases the tools belong to and work on a better layout. Furthermore I want to add content from the course weeks still to come and some experiences when using the tools.
